Why No Map Can Be Perfect – The Math Behind Our Flat World
- Nishadil
- October 21, 2026
- 0 Comments
- 4 minutes read
- 9 Views
- Save
- Follow Topic
The mathematical impossibility of making a perfect world map
A look at why flattening Earth always forces trade‑offs, from the centuries‑old Mercator to the newer Equal Earth projection, and what the UN’s recent map resolution really means.
Ever tried to wrap a basketball in gift‑wrap? No matter how careful you are, the paper folds, creases or tears. That simple kitchen‑table experiment is a perfect metaphor for a problem cartographers have wrestled with for hundreds of years: you simply can’t lay a sphere flat without distorting something.
The issue isn’t a matter of skill or better ink; it’s baked into geometry. A sphere and a plane are fundamentally different shapes, and mathematics tells us there’s no one‑to‑one, distortion‑free mapping between them. So every world map you see is, at its core, a compromise – you get a bit of shape right, a bit of area right, and you sacrifice the rest.
Enter the Mercator projection, the classic that dominated navigation for more than four centuries. Developed in 1569 by Gerardus Mercator, the projection places a cylinder around the globe, touching it at the equator, and projects every point outwards from Earth’s centre. The payoff? Straight lines on the map equal constant compass bearings on the sea – a boon for sailors who could plot a course without constantly recalculating angles.
But the price is steep. Because the cylinder stretches toward the poles, regions like Greenland and Antarctica balloon out to sizes that are wildly inaccurate. On a Mercator map Greenland looks almost as big as Africa, even though the latter is about fourteen times larger. That distortion isn’t just an academic annoyance; it subtly reinforces a Euro‑centric view of the world.
Fast forward to the 1970s, and a German historian named Arno Peters cried out against that bias. He championed an equal‑area map – the Gall‑Peters projection – that preserves the true size of continents and countries. The technique still uses a cylindrical surface, but instead of projecting from the centre of the Earth, it slides points along horizontal lines. The result is that land masses are shown in their correct proportion, but their shapes become stretched, especially near the equator.
Critics of the Gall‑Peters map pointed out the ugly side‑effects: Africa and South America look like elongated ovals, and the familiar silhouettes of countries are hard to recognize. The debate highlighted an uncomfortable truth – you can have accurate area or accurate shape, but not both.
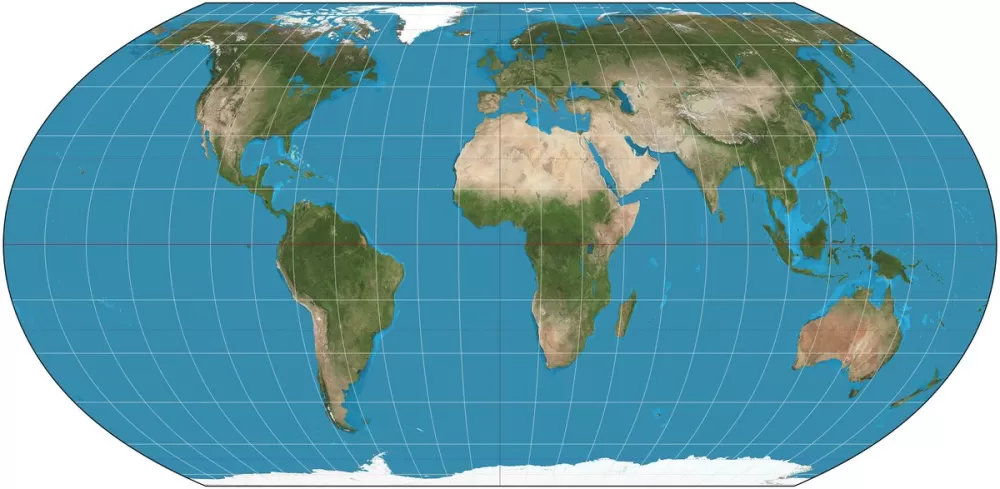
In 2017 a group of cartographers and a software developer in California decided to take another stab at the problem. They liked the visual friendliness of the Robinson projection (a 1960s “compromise” map that interpolates between a set of empirically chosen points), but wanted something that didn’t sacrifice area. Their answer was the “Equal Earth” projection, introduced in 2018.
Equal Earth is a pseudocylindrical projection. Latitude lines stay straight, just like on a classic cylinder, but longitude lines curve except at the prime meridian. The creators first blended the look of two existing maps using custom graphics tools, then derived the mathematical equations that would reproduce that appealing shape. The end product preserves area to within a fraction of a percent while keeping shape distortion to a tolerable minimum – a sweet spot for classrooms, textbooks, and even the United Nations.
Speaking of the UN, on September 4, 2026 the General Assembly passed a non‑binding resolution urging member states, schools and NGOs to replace the Mercator with the Equal Earth projection. Fourteen‑four nations voted in favour, six abstained, and the United States was the lone dissenting voice. Though the resolution carries no legal force, it signals a growing appetite for maps that better reflect geopolitical realities.
So why does this matter to the average person scrolling through a digital atlas? Because maps shape perception. When a child first learns geography on a map that inflates the North Pole, they internalise a skewed view of the world’s size and importance. Swapping to an equal‑area map can subtly nudge that perception toward something more balanced.
At the end of the day, no flat map can be perfect – that’s a mathematical certainty. What we can do, however, is choose the projection that aligns best with the purpose at hand, whether it’s navigating the high seas, teaching elementary geography, or fostering a more equitable worldview. The story of Mercator, Gall‑Peters, and Equal Earth reminds us that every visual representation carries choices, and those choices matter.
Editorial note: Nishadil may use AI assistance for news drafting and formatting. Readers can report issues from this page, and material corrections are reviewed under our editorial standards.